
Troubleshoot Crawl Speed in LLMIC
Locate the waiting stage and test one explanation at a time.
A crawl slows down, so you raise concurrency. The next run sends more requests but finishes fewer usable pages. That response suggests the original bottleneck was not simply a shortage of simultaneous requests.
Troubleshoot crawl speed in LLMIC by identifying which stage is waiting: discovery, requesting, rendering, analysis or completion. Preserve the original run, test a small fixed workload, and change one condition tied to a specific hypothesis. This makes a failed experiment informative instead of producing another unexplained total.
Establish Whether Work Has Actually Stopped
Check whether the count of recorded results is still changing. A slow rate and a stalled run are different symptoms. Near the end, a small number of difficult requests may take longer than the earlier pages, so inspect the remaining work before treating a quiet interval as a failure.
Record the time, displayed status and relevant settings. If you stop a run, mark the saved evidence partial. Do not describe the unprocessed URLs as clean, and do not erase the original evidence by immediately starting a larger investigation.
If the run is still making useful progress and the website is healthy, first decide whether the duration is actually unacceptable for the task. Tuning introduces comparison work; a short, reliable audit may not need a higher peak rate.
Separate Server Pressure From Local Processing
Inspect request outcomes for representative slow or failed URLs. HTTP 429 points toward rate limiting; a timeout needs a different investigation from a denied request. Look for patterns by host and time rather than assuming one combined failure count has a single explanation.
Check the Mac’s workload too. Rendering, analysis and other applications can consume resources even when the server responds promptly. A faster network configuration cannot eliminate work that happens after the response arrives.
If server telemetry is unavailable, say so. You can report the responses observed by the crawl without claiming to know the server’s CPU or capacity. Coordinate with the site owner when additional evidence is needed to distinguish request pressure from a separate incident.
Use a Small Test With One Hypothesis
Choose a fixed list containing affected pages and a few ordinary control pages. Preserve the required rendering and checks. State the suspected cause and the one change that would help test it, such as reducing concurrency when errors appeared after an increase.
Record both useful completions and failures. A run that finishes faster because it abandons more pages is not a successful speed repair. Keep unresolved outcomes visible instead of excluding them from the comparison after the fact.
When multiple conditions must change, document the limitation. The new configuration may work better, but you cannot attribute the improvement to one setting without a more controlled comparison.
Choose the Next Test From the Symptom
| Symptom | Focused investigation | Poor first response |
|---|---|---|
| More 429 responses after a speed increase | Reduce pressure; review rate-limit guidance | Increase concurrency again |
| Simple pages finish, rendered pages lag | Compare representative page types and required rendering | Disable needed evidence collection silently |
| New URLs keep accumulating | Review discovery scope and parameter patterns | Treat a growing workload as a fixed-size speed test |
| Few results change near completion | Inspect remaining tasks and request outcomes | Assume the whole run has stopped |
| Mac is under memory pressure | Review local workload and storage configuration | Blame the website without request evidence |
The table identifies tests, not automatic diagnoses. Confirm the relevant observation before changing configuration. Avoid applying every suggested adjustment at once, because that makes the result difficult to explain or reproduce.
Worked Example: Back Off After an Error Burst
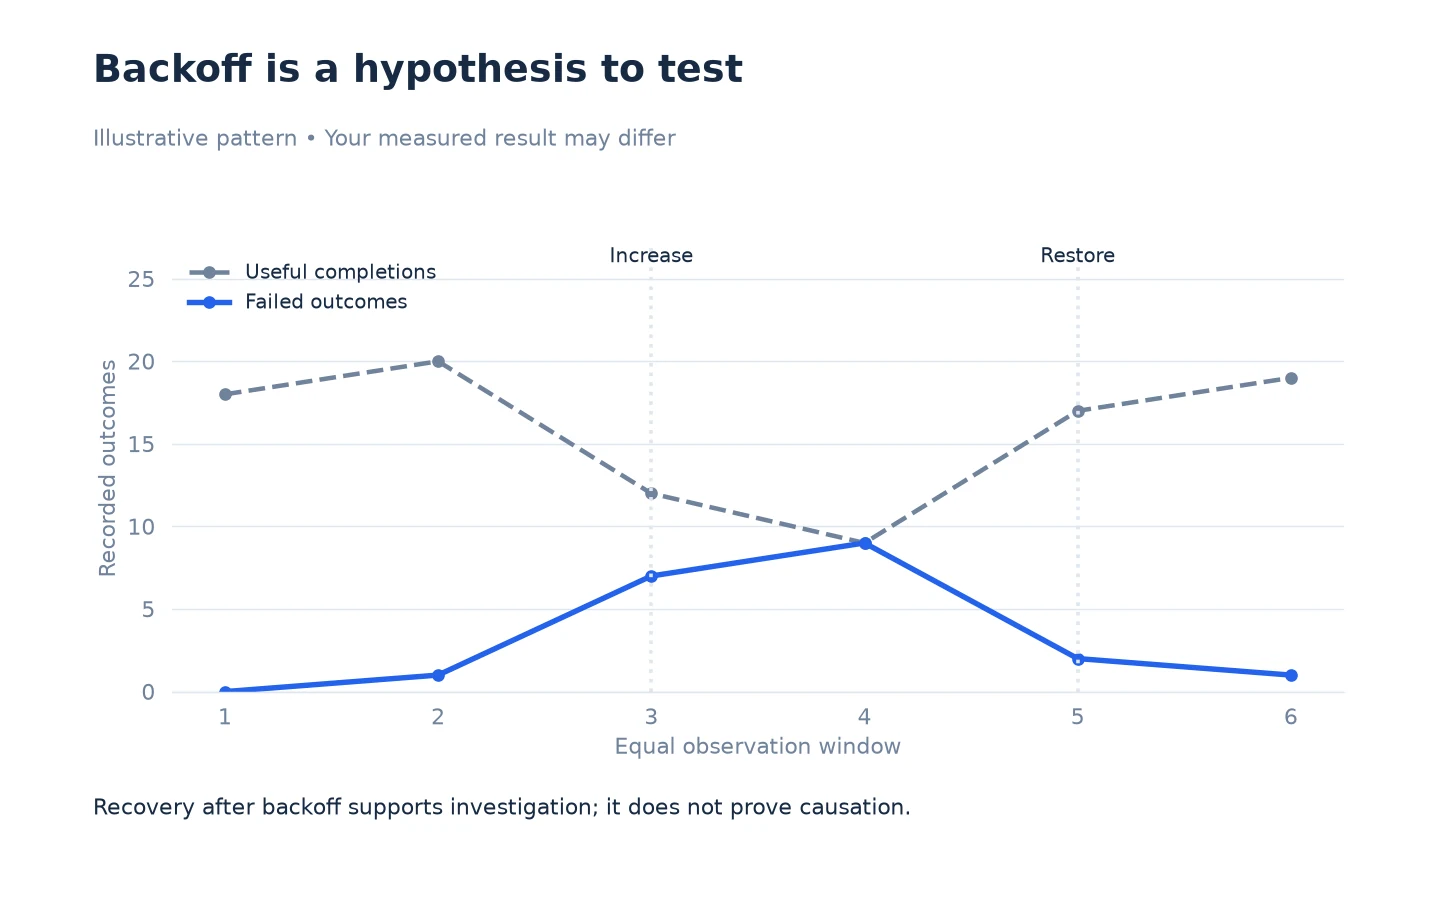
This timeline is illustrative. In six equal observation windows, usable completions are 18, 20, 12, 9, 17 and 19. Failed outcomes are 0, 1, 7, 9, 2 and 1. The operator increases concurrency before the third window and restores the earlier setting before the fifth.
The failure burst and completion drop occur after the increase. Their recovery after restoring the earlier setting supports investigating request pressure, but the timeline alone does not prove causation. The reviewer checks whether the input mix, server conditions or local workload also changed.
The next controlled comparison uses the same affected URL set under the two configurations. If the higher setting repeatedly yields more failed outcomes without useful gains, the earlier setting is the better-supported choice for those conditions.
The plotted failure series represents explicitly recorded failed outcomes in the teaching example. It is not calculated by subtracting attempted requests from completions. Real reports must preserve that distinction to avoid inventing an error rate.
Investigate Heavy Checks Without Losing the Audit’s Purpose
A page that requires rendering or extra analysis can take longer than a simple response check. Determine which evidence the investigation actually needs. If you remove a check for diagnosis, label the run as a diagnostic variation rather than a replacement for the complete audit.
Use a focused sample to investigate expensive page types. Compare whether the expected content is available and whether the required checks finish. Do not generalize the result of one lightweight template to a website with several different rendering patterns.
If the problem appears only on a particular page family, create a separate issue with example URLs and settings. A site-wide concurrency change may be unnecessary when one resource or template is responsible for most of the delay.
Stop When the Evidence Supports a Stable Choice
A useful diagnosis names the symptom, the test, the observed result and the remaining uncertainty. It does not require finding the maximum possible speed. Once a configuration meets the agreed workload and completion requirements without the observed failure pattern, preserve it with its evidence.
Escalate unresolved access or server problems to the owner with representative URLs and timestamps. Avoid repeated high-pressure attempts against a site that is denying or limiting requests. The next useful action may be coordination rather than another local setting change.
Use Verify Changes to Crawl Speed in LLMIC to confirm the chosen configuration under comparable conditions. If the workload itself expanded, return to Configure Crawl Scope in LLMIC before interpreting duration as a performance defect.
Questions About Slow Crawls
Should I raise concurrency when the run slows?
Only when evidence supports that hypothesis. First inspect errors, remaining work and local processing. More simultaneous work can make an overloaded system less productive.
How do I distinguish a slow tail from a stall?
Check whether useful results continue to arrive and inspect the remaining cases. A quiet interval alone is insufficient. Preserve timestamps and status observations when diagnosing a suspected stall.
What should I do with rate-limit responses?
Back off and review the response, including Retry-After when available. Coordinate an appropriate request pattern with the owner. Do not treat rate limiting as a reason to bypass access controls.
Can I disable heavy checks for diagnosis?
Yes, when appropriate, but label the changed workload. A diagnostic run without required rendering or analysis cannot replace the full evidence needed for the original audit.
Why include ordinary control pages in a test?
They help distinguish a page-family problem from a broader request or local-processing issue. Keep their identity and expected behavior in the test record.
Does recovery after a setting change prove the cause?
It supports a hypothesis, but other conditions may have changed too. Repeat a controlled comparison when the decision matters and state any remaining uncertainty.
When should I stop tuning?
Stop when the configuration satisfies the defined workload and reliability requirements. Further tuning is justified by an unresolved problem or meaningful benefit, not by chasing a peak number.
Sources, Statistics and Measurement Notes
The six-window backoff chart is synthetic teaching data. It does not claim measured LLMIC behavior or a universal concurrency recommendation. Control semantics were checked against the crawling-settings implementation on 5 October 2026.
MDN’s HTTP 429 reference, accessed 5 October 2026, explains the rate-limit response. The example’s failed outcomes are not all asserted to be 429 responses; an actual investigation must inspect their recorded causes.