
Export Crawl Speed Evidence From LLMIC
Package recorded results and reproducible calculations for review.
A message saying “the second crawl was faster” is difficult to review without the workload, duration and completion outcomes. A chart can make that comparison easier, but only when the reader can see where its points came from and what each series counts.
Export crawl speed evidence from LLMIC by preserving the recorded crawl and page results, then adding a measurement log for the comparison. Keep observed facts separate from calculated rates and interpretations. Do not invent a historical timeline when the available evidence contains only a final count.
Define the Decision the Package Must Support
State whether the recipient needs to choose a configuration, investigate a slowdown or verify a claimed improvement. A configuration comparison needs equivalent inputs; an incident investigation needs useful timestamps and affected cases. Those packages overlap, but they are not identical.
Name the workload explicitly. Include the input mode, supplied URL list or seed, page types and required checks. Keep the list of unresolved URLs, because a shorter duration can be misleading when fewer pages reached the intended completion stage.
Identify the person who will act on the finding. An application operator needs settings; a site owner needs request outcomes and times; a reviewer needs definitions and comparable populations. Include enough context for that task without distributing unrelated crawl data.
Preserve What LLMIC Actually Recorded
Save the crawl through More, Crawl File (.llmic), Save Crawl File. Export the relevant Pages rows and inspect the resulting CSV. Check the active filters before labeling the file as a full result set.
The page export is not automatically a time-series telemetry export. Inspect the actual fields in your release. If interval measurements were not recorded, report the final count and duration you can establish and design a future measurement run for the missing timeline.
Keep an untouched copy of the saved export. Add calculations and comments in a working copy or separate sheet. This prevents an analyst’s estimate from being mistaken for a value produced by the application.
Use a Measurement Log With Explicit Units
| Field | Required definition | Why it matters |
|---|---|---|
| Run identifier | Unique name, date and timezone | Connects every observation to the right run |
| Workload | Exact input or bounded discovery scope | Prevents unlike populations being compared |
| Interval | Start and end of the observation window | Defines the denominator for a rate |
| Completion count | The stage counted and whether cumulative | Avoids confusing fetched and analyzed pages |
| Failed outcomes | Recorded failures and their classification | Keeps reliability visible beside speed |
| Settings | Concurrency, delay, rendering and required checks | Makes the experiment repeatable |
If you collect observations manually, label them manual and preserve their actual timestamps. Do not imply second-by-second precision from occasional screenshots. A gap between observations should remain a gap unless you clearly label an interpolation as an estimate.
Use one timezone throughout the working log or preserve timezone offsets explicitly. Clock ambiguity can make a setting change appear before or after the wrong observation. Keep server logs and local observations distinct when their clocks or collection methods differ.
Calculate Rates Without Mixing Cumulative and Interval Counts
A cumulative completion count is the total reached by a particular time. To calculate completions within an interval, subtract the earlier cumulative count from the later count, provided both use the same definition and belong to the same run.
Divide that increment by the interval duration in the unit you intend to report. For a per-minute rate, use minutes. Do not plot cumulative totals as though they were per-minute rates; a steadily rising total can coexist with a falling rate.
Check for resets, restarted runs or changed definitions before subtracting values. A negative difference after a restart is not a negative completion rate. It is a sign that the observations should not be treated as one continuous series.
Worked Example: Derive a Rate From Recorded Checkpoints
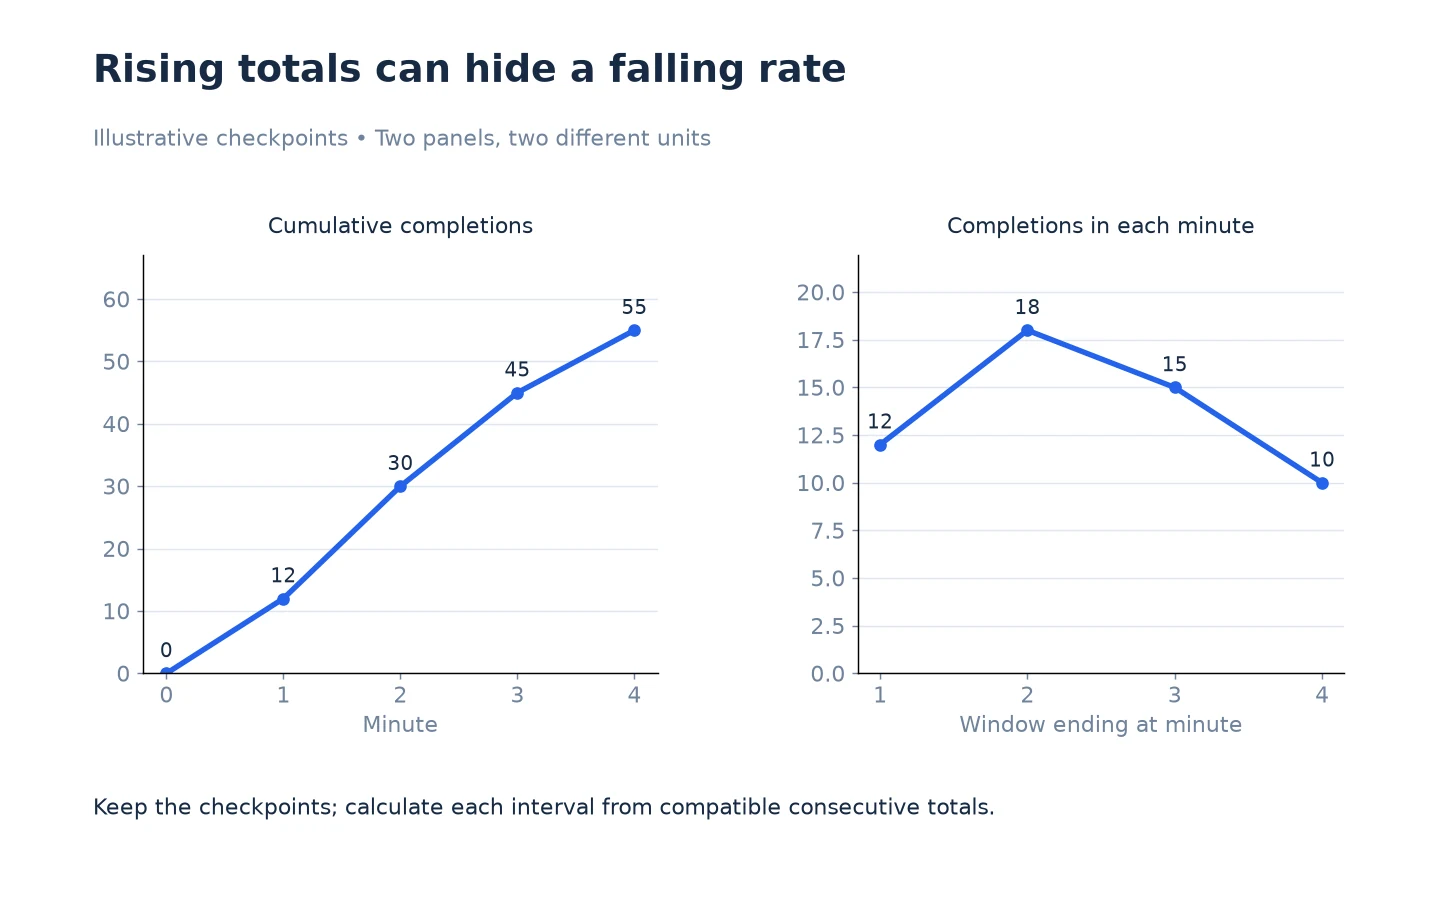
This example is illustrative. A measurement log records cumulative useful completions of 0, 12, 30, 45 and 55 at minutes zero through four. The interval increases are therefore 12, 18, 15 and 10 completions across the four one-minute windows.
The paired chart shows the cumulative total and the derived interval counts in separate panels with different axis labels. The total continues upward while the per-window count falls after the second interval. That is not a contradiction: progress continues at a lower rate.
The working sheet retains the five original checkpoints and the four calculated differences. A reviewer can reproduce the calculation without trusting the chart’s shape. If the checkpoint at minute two were missing, the reviewer could calculate a two-minute average across the available boundaries, but should not invent the two individual one-minute values.
These values are teaching data, not exported LLMIC telemetry or a performance result. Use the same arithmetic only when your real observations have matching definitions and reliable timestamps.
Review the Files Before Sharing Them
Open the saved CSV and confirm that headers, URLs and quoted text remain in the correct columns. Check known included and excluded cases when the export is filtered. Verify that the file names in the measurement log match the actual package.
Review chart labels, units and sample size. Include a caption explaining whether the values are measured, manually recorded, calculated or illustrative. If the chart compares two runs, identify both configurations and the scope that makes them comparable.
Remove unnecessary private URLs, tokens and personal information from the shared copy. Preserve redaction notes so a recipient does not treat removed values as unobserved data. Use the team’s approved sharing location and retain original evidence according to its access and retention rules.
End With a Reproducible Request
Ask the recipient for a decision grounded in the package: inspect a failure interval, repeat a defined configuration or confirm a server-side event at a recorded time. Avoid asking someone to “make it faster” without naming the workload or reliability requirement.
When the team changes a setting, create a new result package instead of overwriting the baseline. Use Verify Changes to Crawl Speed in LLMIC to check the outcome. For interpretation of the existing measurements, consult Review Crawl Speed Results in LLMIC.
Questions About Speed Evidence
Does the Pages CSV contain a complete speed timeline?
Do not assume it does. Inspect its actual fields. Use a separately documented measurement log when interval telemetry is unavailable, and label manual observations accurately.
Can I draw a line chart from only the final total?
You can show the final observation, but you cannot recover an actual historical curve from it. Do not invent intermediate points. Collect a timeline in a later controlled run if needed.
How do I convert cumulative counts into interval counts?
Subtract consecutive compatible cumulative observations from the same run. Record the interval duration and divide by it only when calculating a rate. Keep the original checkpoints for review.
What if a checkpoint is missing?
Use the available boundaries for an explicitly longer interval or mark the gap. Do not pretend you know how work was distributed inside the missing period.
Should calculated values be stored with raw observations?
Keep them in clearly labeled columns or a separate working sheet. Preserve the original export so another person can distinguish recorded evidence from later calculations.
Which unit should a speed chart use?
Use the unit that matches the defined observation, such as useful completions per minute. Label it explicitly and avoid placing counts and latency on one unlabeled axis.
What must accompany a faster-run claim?
Include comparable inputs, required checks, elapsed duration, useful completion counts and unresolved failures. Without those, a shorter run may simply represent less work.
Sources, Statistics and Measurement Notes
The saved-crawl menu and Pages CSV workflow were reviewed on 5 October 2026. The checkpoint log is an analyst-created record, not a claim of a dedicated automatic telemetry export in every LLMIC release.
All values in the paired chart are illustrative. Interval counts are calculated from the stated cumulative checkpoints. No customer performance, server capacity or expected completion time is inferred from them.