
Review Crawl Speed Results in LLMIC
Read the timeline without confusing activity, completion and quality.
The speed indicator rises during the first part of a crawl, then falls. That shape alone does not tell you whether the website slowed down. The page mix may have changed, the run may be draining its final work, or more time may be going into rendering and analysis.
Review crawl speed results in LLMIC by separating elapsed time, request activity and useful completed observations. Keep failures and the remaining workload beside those measures. A single peak value cannot explain an entire run, and a short interval should not be extrapolated into a guaranteed completion time.
Define the Work Being Counted
Start with the input mode and population. A finite URL List has a known supplied set; a linked crawl can continue discovering new addresses. Their progress totals behave differently, even when both are operating correctly.
State whether your measure counts attempted requests, successful fetches, analyzed pages or saved results. Those are different stages. Do not divide one stage’s count by another stage’s duration and label the result simply “crawl speed.”
When a report does not expose a required measurement, mark it unavailable. You can still describe the recorded completion count and elapsed time. Do not reconstruct a detailed historical speed curve from a final total or pretend that a screenshot contains every interval.
Read the Run in Phases
Separate startup, sustained processing and completion. Startup may involve preparation before many usable results appear. During sustained processing, the rate reflects the current mix of work. Near completion, a few slow tasks can remain after most pages are done.
Record meaningful events on the timeline: a setting change, a network interruption, a new page family or a visible error burst. Treat these as context for investigation, not proof of causation. A change happening near a slowdown does not establish that it caused the slowdown.
Compare equal observation windows when charting rates. A one-minute interval and a ten-minute interval can smooth the same underlying activity differently. Keep the window definition visible and avoid drawing a continuous line across a period for which no data was recorded.
Compare Activity With Useful Outcomes
| Measure | Useful interpretation | Common misreading |
|---|---|---|
| Attempted requests | How much request activity occurred in the defined window | Every attempt produced an inspected page |
| Useful completions | How many observations satisfied the chosen completion definition | All completed pages passed their SEO checks |
| Failed outcomes | Cases requiring error review or another observation | Every failure has the same cause |
| Elapsed duration | Time spent on the recorded workload | A portable benchmark for any website |
A completed page can contain many findings. Completion describes processing, not site quality. Likewise, a failed request is not proof that the target page is permanently broken. Inspect the actual outcome and retain its time and scope.
If attempts increase while useful completions flatten, investigate the gap. Waiting work, retries, timeouts or heavier processing can contribute. The chart alone cannot distinguish them; the next step is to inspect representative records and the run conditions.
Worked Example: A Mid-Run Gap
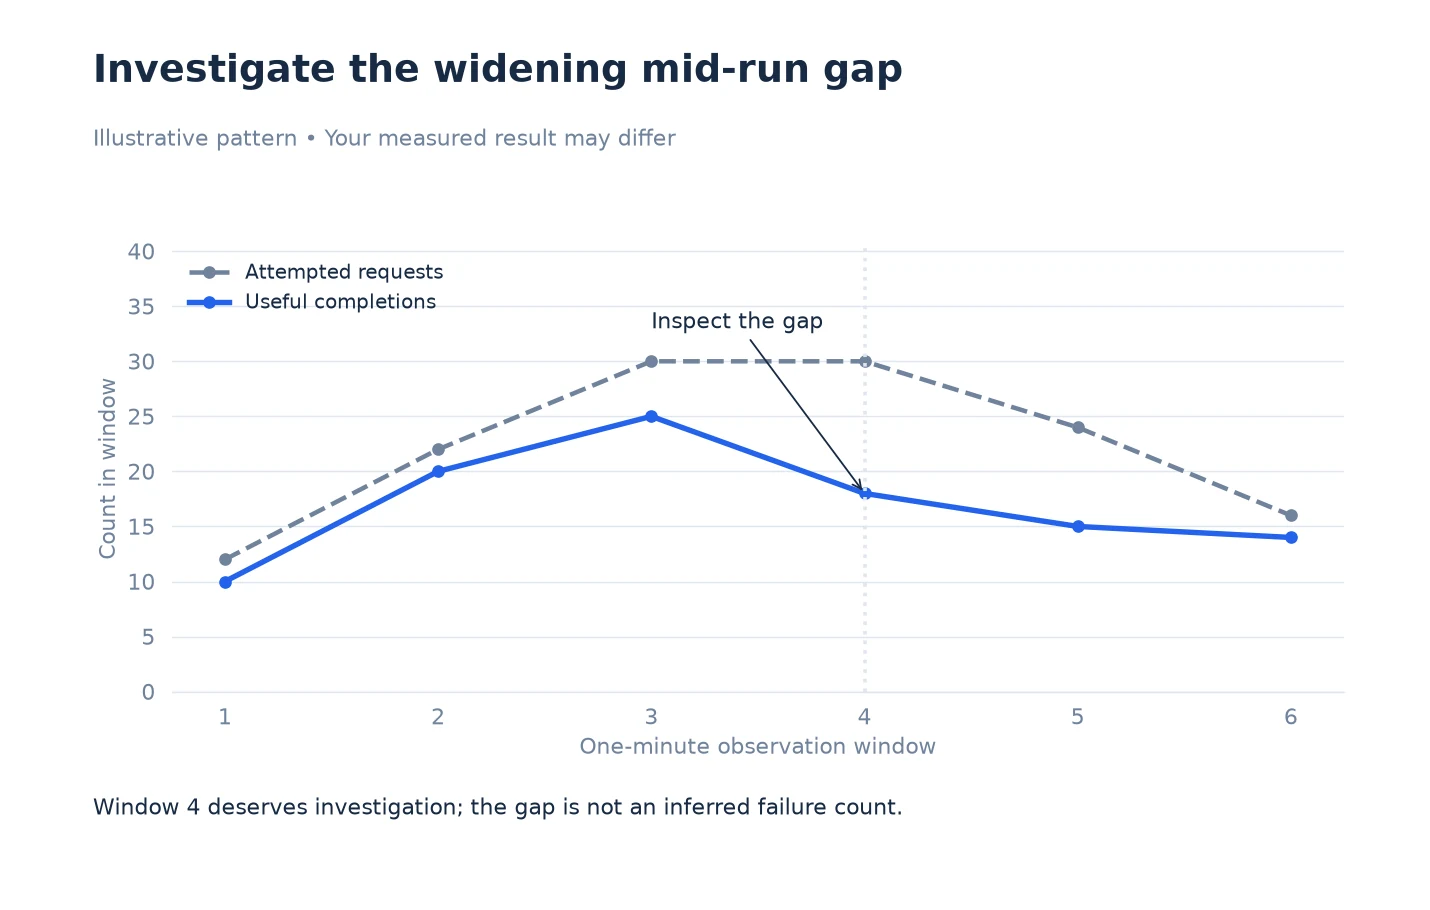
The following six one-minute windows are illustrative. Attempted requests are 12, 22, 30, 30, 24 and 16. Useful completions are 10, 20, 25, 18, 15 and 14. Both measures are counts within each window, not cumulative totals.
In the fourth window, attempts stay at thirty while completions fall to eighteen. That is the first place to investigate. The team checks whether the page mix changed, failures increased or work remained in flight. It does not announce a twelve-request failure count merely by subtracting the two plotted values.
The last window has fewer attempts and a smaller gap. That could be consistent with the run finishing, but the reviewer checks the remaining work and finish state before concluding so. A declining rate at the end is not automatically a performance regression.
The chart’s purpose is to locate an interval worth examining. It is not a performance promise for LLMIC and does not describe measured customer behavior. A real report needs recorded observations with the same definitions and time windows.
Examine Latency and Failures Without Mixing Units
Keep response-time measurements separate from counts per minute. A higher latency value and a lower completion rate can be related, but they are not the same metric. Label units and explain whether latency is a single observation, an average or another summary actually provided by the evidence.
Inspect specific failed cases rather than only a combined failure total. A denied request, a timeout and a missing resource imply different next actions. Check whether failures cluster around a host, template or period before assigning a general cause.
Do not infer server health solely from the Mac’s workload, or local processing pressure solely from slow responses. Review the available evidence on both sides when possible. If you have no server-side telemetry, keep that limitation explicit.
Compare Two Runs Only After Reconciling Their Scope
Check that the input set, rendering choices and required checks match. A shorter run that omits difficult pages is not evidence of an improved configuration. Reconcile the important URLs before interpreting elapsed-time differences.
Record external conditions that could affect the result, such as concurrent local work or a different deployment. Repeat a surprising difference under comparable conditions before presenting it as a reliable improvement. If the workload is intentionally different, describe it as a different test.
Use Troubleshoot Crawl Speed in LLMIC when the timeline identifies a suspicious interval. For reporting, use Export Crawl Speed Evidence From LLMIC to preserve the measurement definitions beside the numbers.
Questions About Reading Speed Results
Does a falling rate mean the crawler is stuck?
Not necessarily. Check whether useful results are still accumulating and whether only a few tasks remain. Review the finish state and actual errors before diagnosing a stall.
Can I compare peak speed between two runs?
Peak values alone are weak evidence. Compare equivalent workloads over meaningful durations and include usable completions, failures and any omitted pages. Short bursts can exaggerate differences.
Is the gap between attempts and completions the failure count?
No. Work can cross time-window boundaries, and retries or ongoing processing can affect the gap. Use recorded outcomes to count failures rather than subtracting two different stages.
Why should I label the chart’s time window?
Rates depend on the observation period. A short window shows more fluctuation than a long one. Readers need the interval definition to interpret the shape and compare another run fairly.
Does a completed page mean its audit passed?
No. It means the relevant processing stage completed under your definition. The page may still have technical or content findings that need review.
What if I only have a final count and duration?
Report those facts with the workload definition. Do not invent intermediate points or a historical curve. A future controlled run can collect the timeline needed for a more detailed investigation.
Can a slow tail be normal?
A few remaining slow tasks can reduce the final rate. Confirm that explanation from the remaining work and outcomes; do not assume every slow ending is harmless.
Sources, Statistics and Measurement Notes
The six-window chart uses invented values to teach interpretation. No performance measurement, customer outcome or completion-time guarantee is implied. Chart windows are one minute each; attempts and useful completions refer to different stages and cannot be subtracted to infer errors.
Google’s crawl-budget guidance, accessed 5 October 2026, provides background on the relationship between server health and crawl capacity. Google’s system is separate from the local LLMIC measurements discussed here.