
What Is Share of Model? Formula, Example and Tracking Method
A visibility percentage needs a sample and a denominator. Here is how to make the calculation inspectable.

What Is Share of Model?
Share of model describes a brand’s presence in a defined sample of AI-generated answers. A measurement may count the proportion of valid responses that mention the brand or the brand’s share of appearances among a fixed competitor set. Always state the method: those percentages have different denominators.
Imagine a marketing team seeing a favorable percentage in a dashboard, then discovering that its test questions included the brand name. The number may help assess how accurately an assistant describes the brand. It does not answer the same question as whether that assistant independently includes the brand when a potential customer asks for options.
A useful measurement connects a question, a retained answer and a clearly defined calculation. This guide provides a repeatable worksheet and an illustrative example. It does not treat sampled AI visibility as market share, a search ranking or a forecast of subscriptions.
Define the Measurement Before Choosing a Formula
Begin with the decision you need to make. If you want to know how often a brand appears in discovery answers, use unbranded questions that represent that discovery task. If you want to compare appearances across a category, choose the tracked competitor set and counting rule before collecting results.
Specify what qualifies as a brand match. Exact names, aliases and ambiguous short names can produce different results. Retain the passage containing a match so a reviewer can distinguish a real product mention from another use of the same text. Record corrections instead of treating every string match as a confirmed recommendation.
Keep mentions, citations and recommendations in different fields. A response can name a product without linking its website. It can link a source without recommending that product. It can recommend a brand while stating an incorrect capability. These observations answer related questions but should not be compressed into one unexplained success percentage.
| Measure | Numerator | Denominator | Question it answers |
|---|---|---|---|
| Brand mention rate | Valid responses containing the brand | All valid responses in the sample | How often did the brand appear? |
| Website citation rate | Valid responses linking the reviewed website | All valid responses in the sample | How often was this website linked? |
| Competitive appearance share | The brand’s counted appearances | All counted appearances for the fixed tracked set | What share belonged to this brand? |
| Run completion rate | Valid collected responses | All planned runs | How much of the intended sample was observed? |
For this guide, an appearance means one brand-response pair. Count a brand once in each response even if its name is repeated. Another counting convention can be useful, but label it and keep it consistent across periods.
How Do You Calculate Share of Model?
For coverage, divide valid responses mentioning the brand by all valid responses in the stated sample, then multiply by 100. For competitive appearance share, divide that brand’s counted appearances by all counted appearances across the fixed tracked set, then multiply by 100.
Write the fraction beside the percentage. “27 of 90 valid responses” is easier to audit than “30% visibility” because it reveals both sample size and the event being counted. The fraction also makes a missing-observation problem visible when it is presented alongside the number of planned runs.
Do not add weighted prominence, sentiment or accuracy into these formulas without defining a new measure. If those factors matter, retain separate fields or document the weighting method. A recipient should be able to reproduce the calculation from the exported observations and understand what a change means.
Worked Example: One Sample, Four Different Percentages
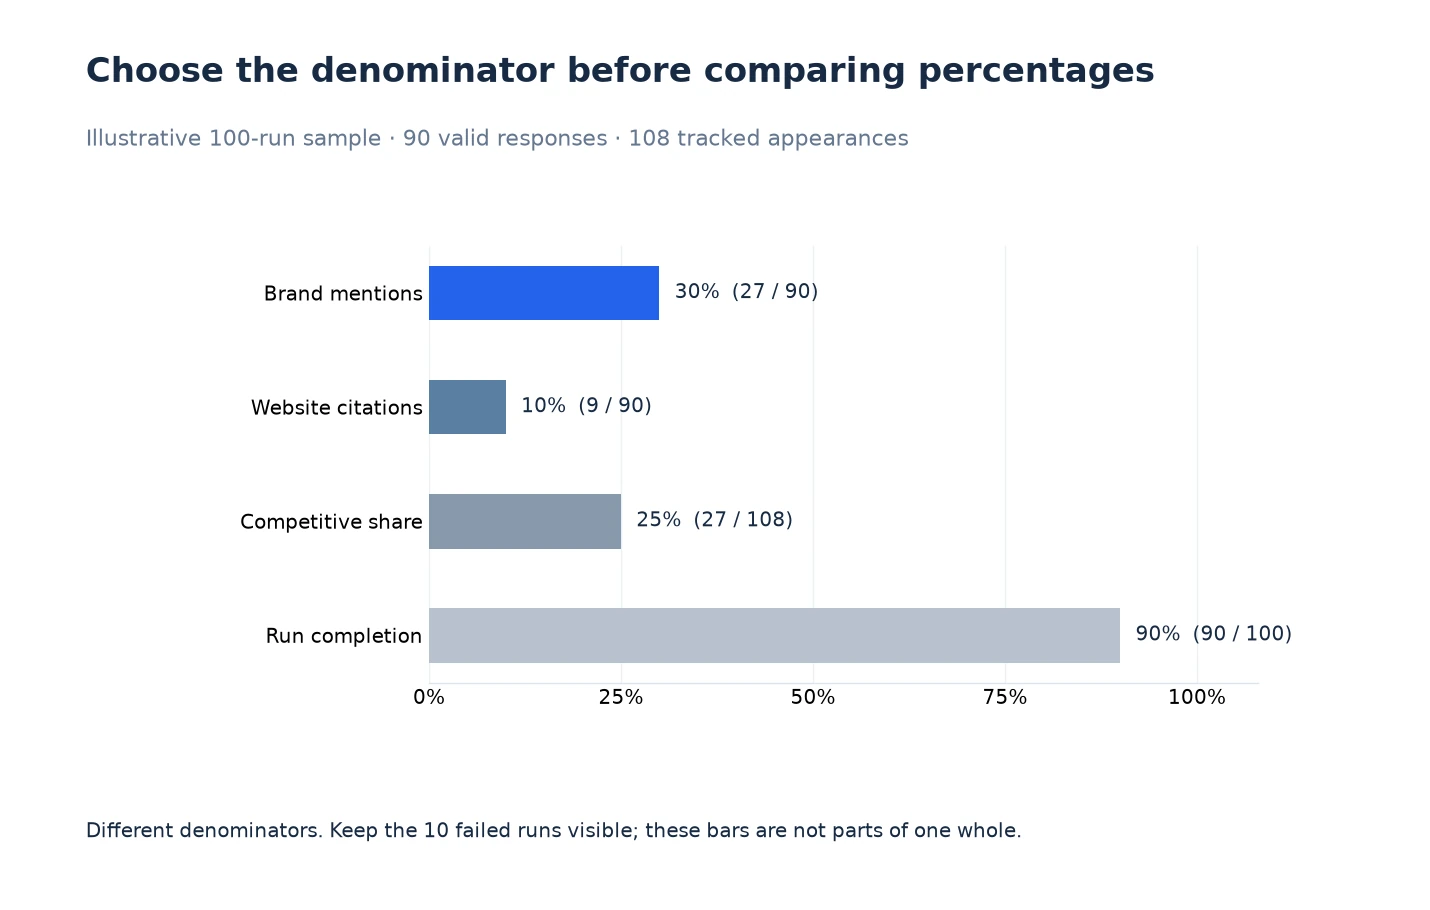
The following numbers are an illustrative dataset, not LLMIC customer results. A team plans 100 runs against a fixed prompt set. Ten runs fail, leaving 90 valid responses. The brand appears in 27 responses, and its website is linked in nine. Across the tracked brands, the sample contains 108 brand-response appearances.
| Result | Calculation | Interpretation |
|---|---|---|
| 30% brand mention rate | 27 / 90 × 100 | Brand appeared in 27 valid responses |
| 10% website citation rate | 9 / 90 × 100 | Website was linked in nine valid responses |
| 25% competitive appearance share | 27 / 108 × 100 | Brand accounted for a quarter of tracked appearances |
| 90% run completion | 90 / 100 × 100 | Ten planned observations remain unavailable |
The chart gives each percentage its own labelled fraction. These values cannot be added into a pie chart: they describe different events and denominators. A 30% mention rate and a 10% citation rate are not disjoint pieces of one whole.
The failure count remains part of the result. If failures cluster around one provider or question type, the retained answers may overrepresent the easiest observations to collect. Resolve the collection problem or narrow the conclusion before comparing the sample with another period.
Build a Tracking Worksheet You Can Inspect
Create one row for every planned observation. Include a run identifier, timestamp, provider or product, model where available, market, language, search mode, prompt version and response status. Attach the retained answer or an evidence reference. Keep failed and unavailable rows in the worksheet.
For each valid response, add reviewed fields for brand mention, cited website URL, recommendation context and factual accuracy. Keep the excerpt that supports each review. A URL appearing in answer text is a candidate link to inspect; it is not automatically a verified citation of your website or evidence that the provider relied on that source.
Record whether the prompt names the brand. Place brand-in-prompt accuracy tests in a separate group from unbranded discovery tests. A change to the wording can affect the task being measured, so keep prompt versions stable or report the change rather than presenting unlike samples as a trend.
Choose a modest, relevant question set that represents real decisions. Questions from support conversations, Search Console and product evaluation can inform it. Generated suggestions can extend the list, but review them as hypotheses. The query fan-out guide explains how to connect questions to appropriate existing pages.
Compare Periods Without Changing the Experiment
Hold the prompt set, provider configuration, market, counting rule and competitor set steady. Compare complete collection windows and retain the valid-response denominator for each. If any input changes, document it and avoid describing the resulting difference as a simple improvement or decline.
Review per-provider results before combining them. An aggregate can move because a provider returned more valid responses in one period, even when its own mention rate stayed the same. Show the sample composition so a larger contribution from one provider does not become an unexplained brand trend.
Small samples deserve restrained conclusions. With ten valid answers, one additional mention changes the rate by ten percentage points. That arithmetic illustrates sensitivity; it does not establish a reliable ten-point visibility improvement. Repeat observations and inspect their content before using the change to prioritize major work.
How Should an Agency Report Share of Model?
Give the client the decision first, then the evidence. Identify which questions produced useful mentions, which answers described the product incorrectly and which sources were actually linked. Attach the calculation method and the tested scope so the client can compare the result with later work.
Assign actions to specific gaps. A factual error may need a clearer product explanation and consistent supporting information. A missing answer on an existing guide may need an evidence-backed section. A collection failure needs a better observation process. These are different interventions, and a favorable mention count cannot verify all three.
Connect the report to the relevant next page or workflow. Avoid promising that a directory profile, a new FAQ or a longer article will generate citations. Useful content and legitimate external coverage can help people evaluate the product, while actual search and provider observations establish what appeared in the tested conditions.
A Share of Model Agency Handoff
| Observation | Owner and action | Acceptance check |
|---|---|---|
| A provider run failed | Analyst: repair collection and repeat the same prompt and settings. | Retain the successful response and failure history; report the eligible denominator. |
| An answer describes the product incorrectly | Product reviewer: confirm the correct fact and the source a reader can verify. | Review the original and repeated answer against that dated fact; keep unresolved errors visible. |
| An existing guide leaves a relevant question unanswered | Editor: add a useful, reviewed answer to the intended page. | Check the live page, then repeat the matched observation. Publication alone does not prove a visibility gain. |
| A valid answer does not cite your website | Analyst: inspect the linked sources and their relevance before recommending a site edit. | Report the observed absence for this sample. Do not label it a technical fault or a guaranteed repair opportunity. |
Where Does Google AI Overview Measurement Fit?
A website’s declared facts, provider API samples and Google Search observations are separate sources. Google’s current guidance requires indexed, snippet-eligible pages and site inclusion in Search generative AI features in Search Console. Check that inclusion setting as part of the eligibility review. Eligibility does not guarantee selection; read reporting according to the dimensions actually available in the property.
If a report groups generative features together, retain that label instead of calling the whole result AI Overview citations. Likewise, an API response from another provider is not an observation of Google’s consumer search interface. Keep the provider, prompt or query, date, source URL and reporting method beside the result.
Use LLMIC With the Measurement Boundaries Visible
LLMIC offers share-of-model documentation and AI benchmark guidance for supported product workflows. Check current plan access and provider requirements before using them in a client commitment. Keep public feature claims distinct from capabilities seen only in a development build.
When reviewing automatic labels, inspect the retained response and URL evidence before reporting a confirmed mention or website citation. API output can differ from consumer interfaces, and string matching can need human correction. The worksheet in this guide is a review method; it does not assert that every field is automatically exported by the application.
For site changes, connect the finding to the page evidence and a fresh verification step. A local technical repair can be verified separately from its later discovery outcome. Use LLMIC’s feature comparison to choose the supported workflow, then evaluate actual search exposure and meaningful visitor actions through their own records.
Frequently Asked Questions
Is share of model the same as market share?
No. It describes the selected answer sample under the stated method. Market share measures a different population and cannot be inferred from a collection of AI responses.
Should failed runs count as answers without a mention?
Retain them as unavailable observations and report completion alongside the valid sample. Investigate systematic failures before interpreting a visibility difference.
Can repeated brand names inflate the result?
They can under an occurrence-based method. This guide counts each brand once per response. Document the convention so repetition cannot silently change the metric.
How should I handle a prompt that includes the brand name?
Keep it in a separate accuracy or branded-question group. It measures a different task from unbranded discovery and should not inflate that discovery sample.
Does a URL in an answer prove a citation of my website?
Inspect the exact destination and context. A URL extraction can include unrelated links, so report reviewed website citations separately from responses containing any URL.
Sources, Statistics and Measurement Notes
Reviewed on 12 October 2026. The formula worksheet and 100-run dataset are original illustrative methods; they are not measured customer results or a universal industry standard. Public product boundaries were checked against LLMIC’s current feature and documentation pages, with source review used to identify interpretation limits.
Google’s generative-AI optimization guide explains supporting-link eligibility and the limits of guaranteeing inclusion. No platform-user totals, future-year predictions or third-party ranking-lift estimates are needed for the calculations in this guide.
Check the website behind the idea.
Use LLMIC to crawl pages, review the evidence and organise the next actions in one native Mac workspace.